HEAT NETWORKS
Guru Pinpoint: Market leading software for better performing, regulation-ready heat networks
Guru Pinpoint displays heat network performance data in digestible charts and dashboards helping you to spot problems and identify trends.
Upcoming regulation will demand better performance from heat networks, with data reported annually. It’s more important than ever to ensure you are able to accurately capture data from your heat network, monitor it and report on it in order to be regulation compliant.
Guru Pinpoint supports housing associations, local authorities, developers and ESCOs to design, adopt and operate efficient heat networks, and prepare for future regulation.
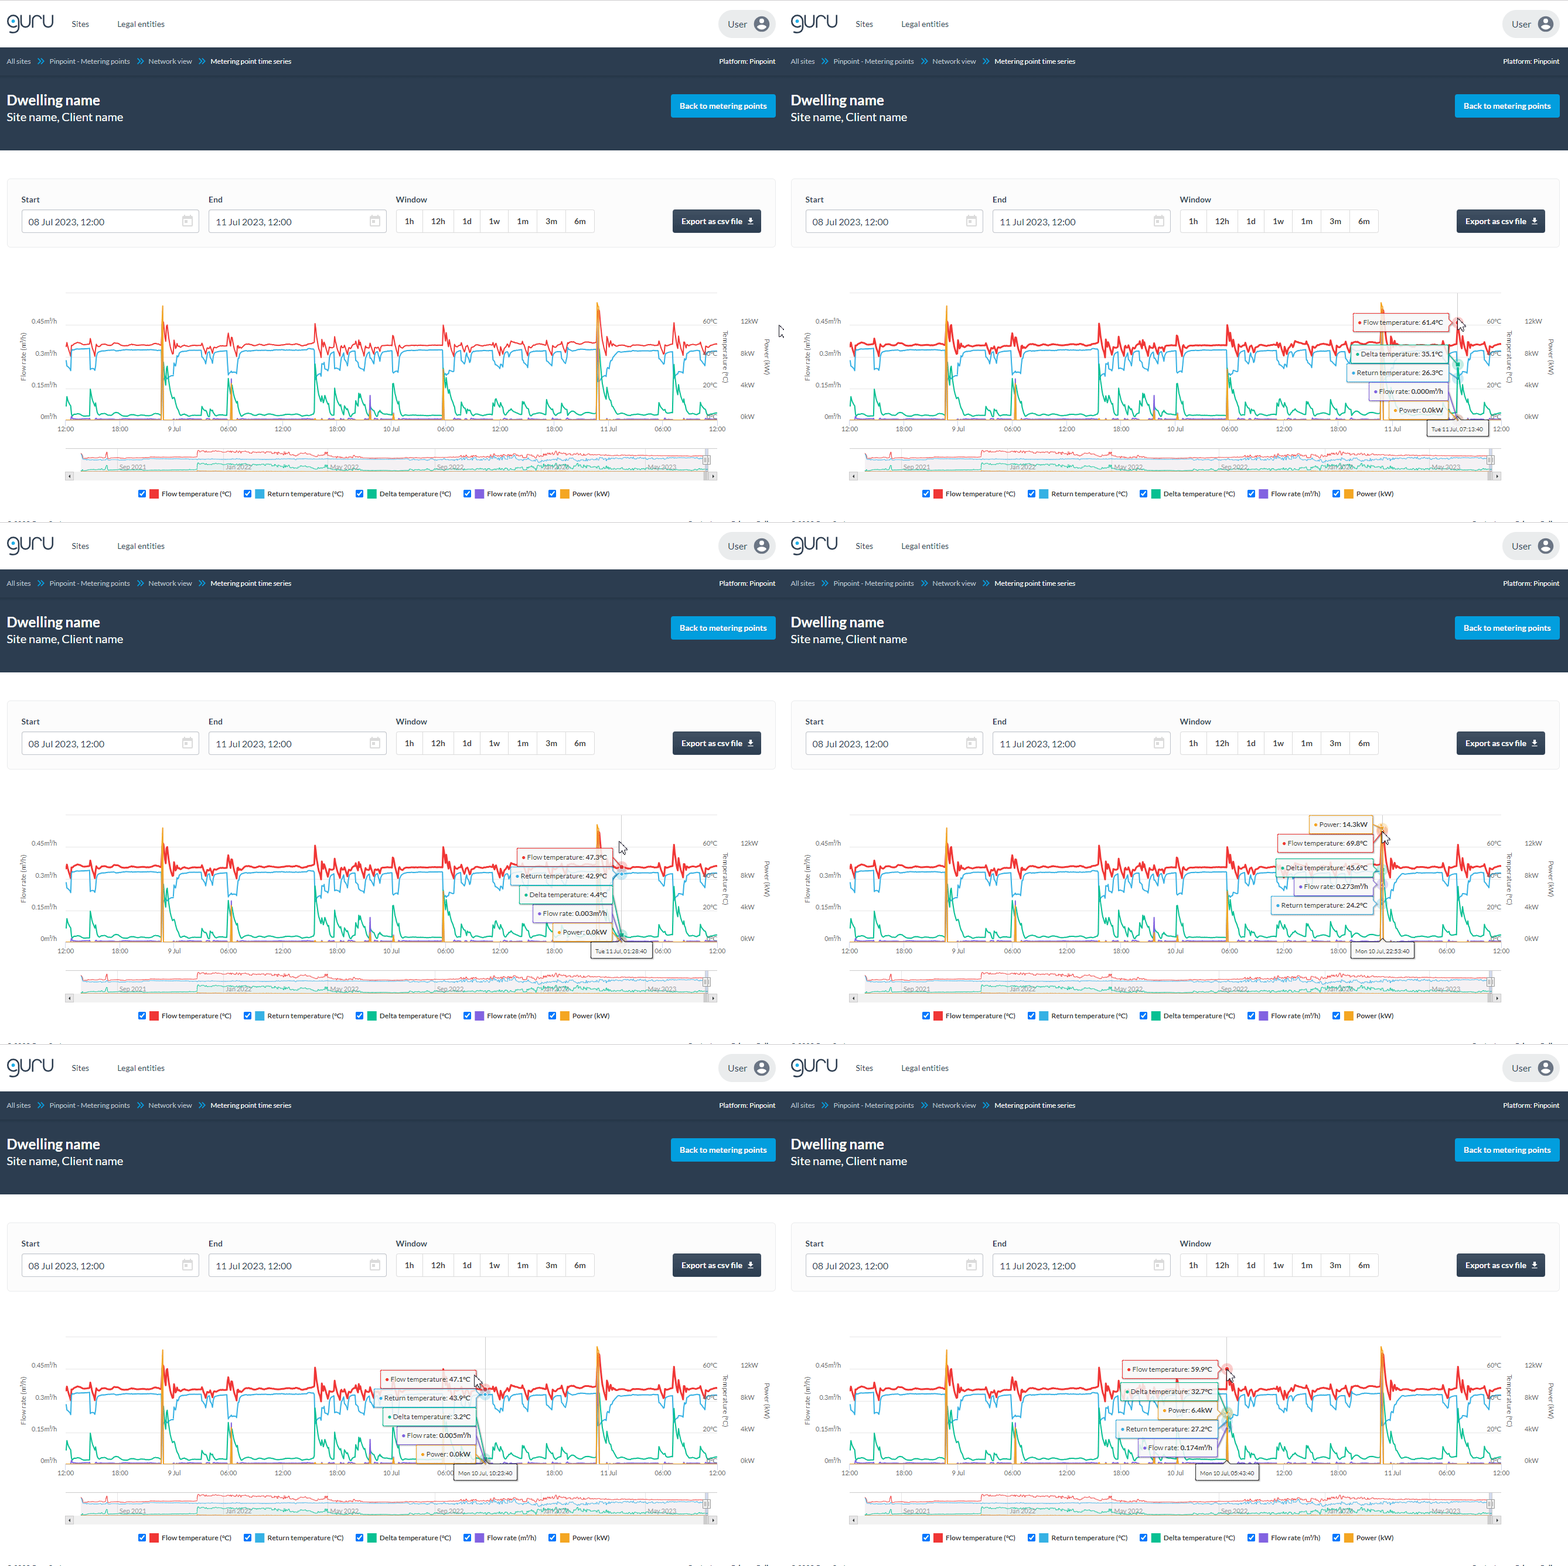
The detailed, diagnostic information provided by real-time network performance data was critical to identifying technical irregularities and the causes of inefficiency. It was vital that these issues were spotted at a time when our contractors were on site.
Victoria Keen, L&Q Energy
NETWORK PERFORMANCE
Spot problems early
COMPLIANCE
Prepare for regulation
Ofgem will begin regulating heat networks in 2025. Changes will include a requirement for all heat networks to report on their energy performance data.
Guru Pinpoint gives you the visibility to identify and fix problems so that your heat networks meet standards to avoid being flagged as non-compliant with regulation. Guru Pinpoint stores your historical site performance data helping you to meet regulatory requirements.
COMPLETE VISIBILITY
Visualise performance data, not just kWh
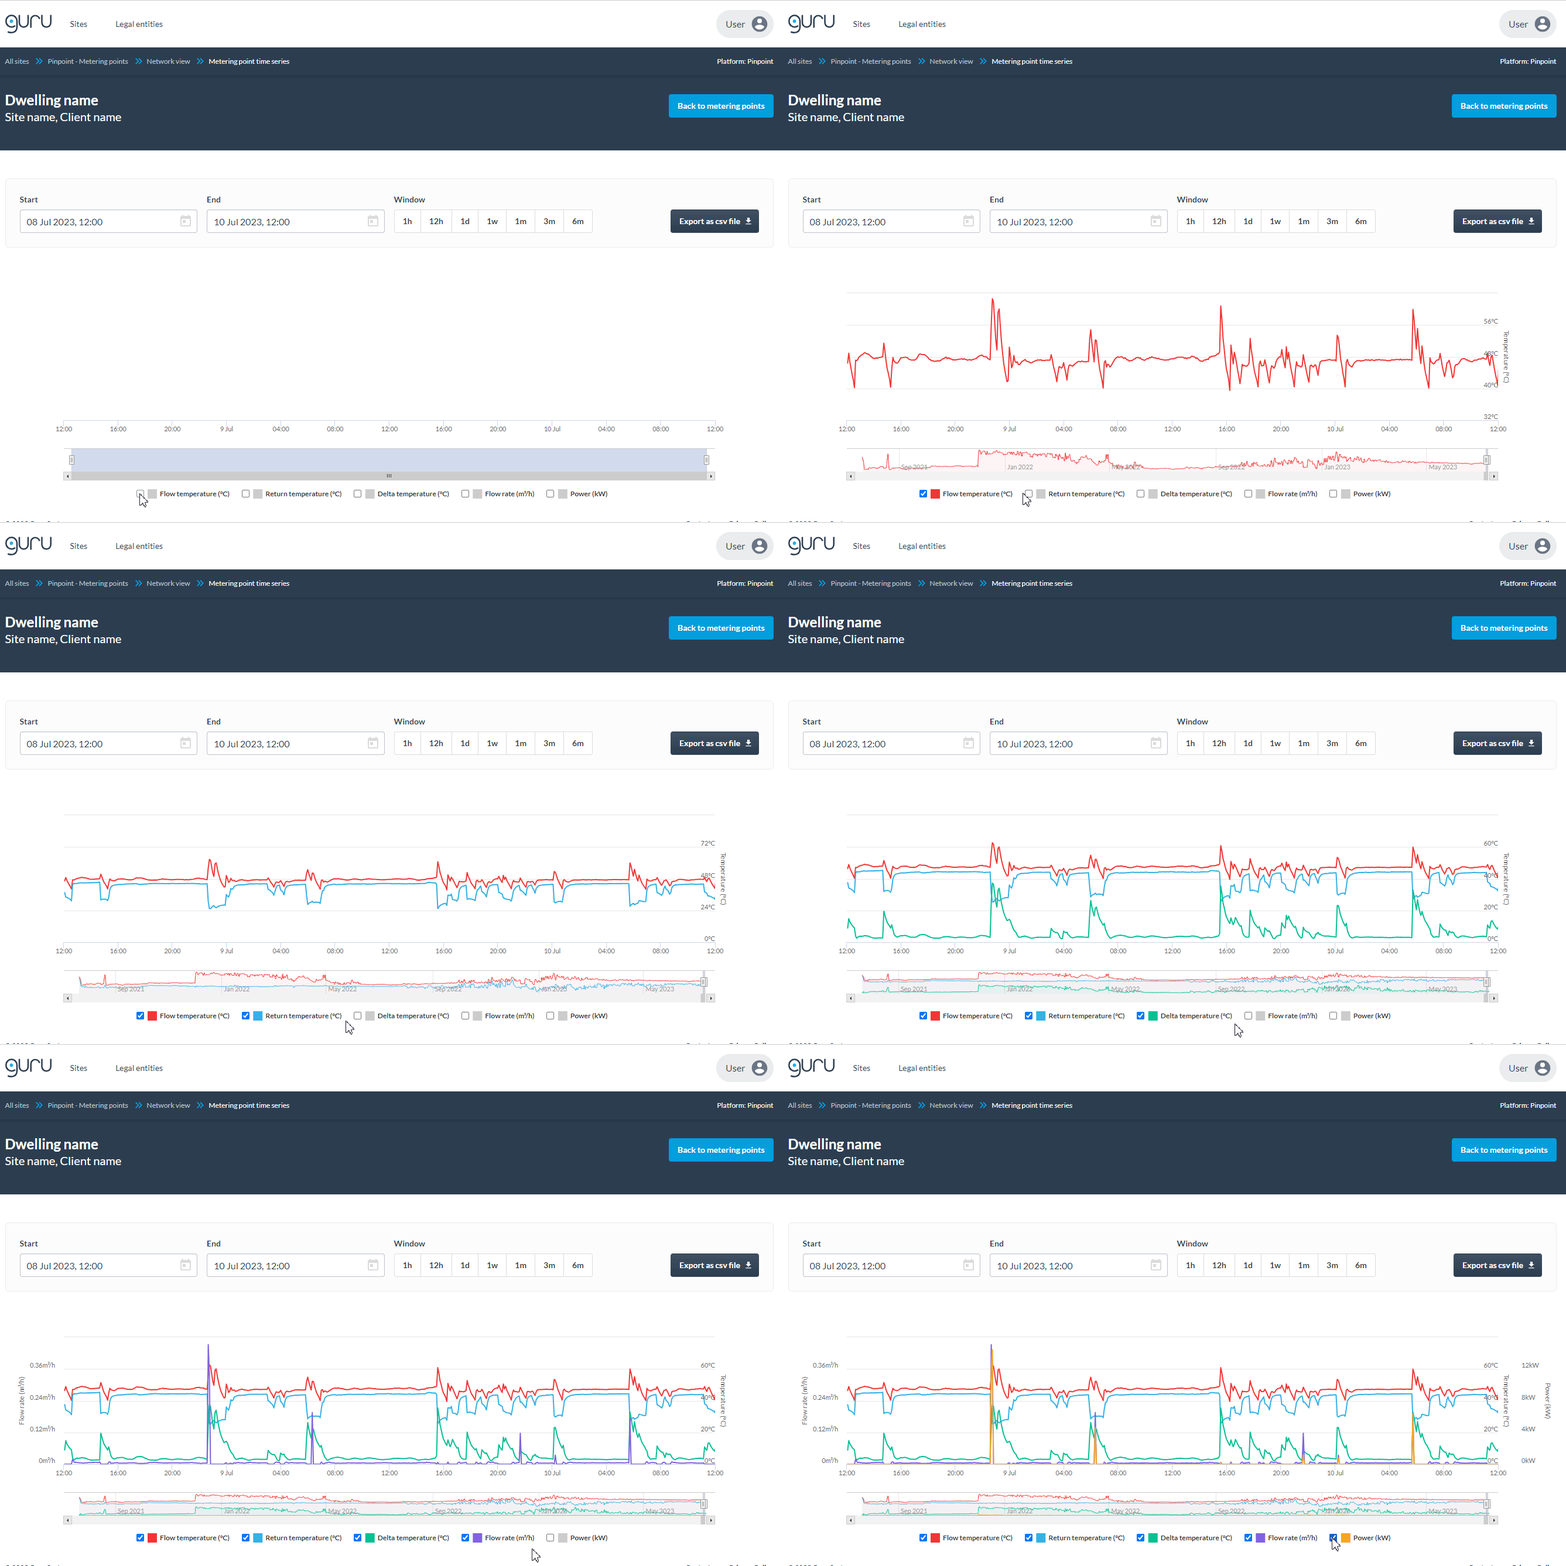
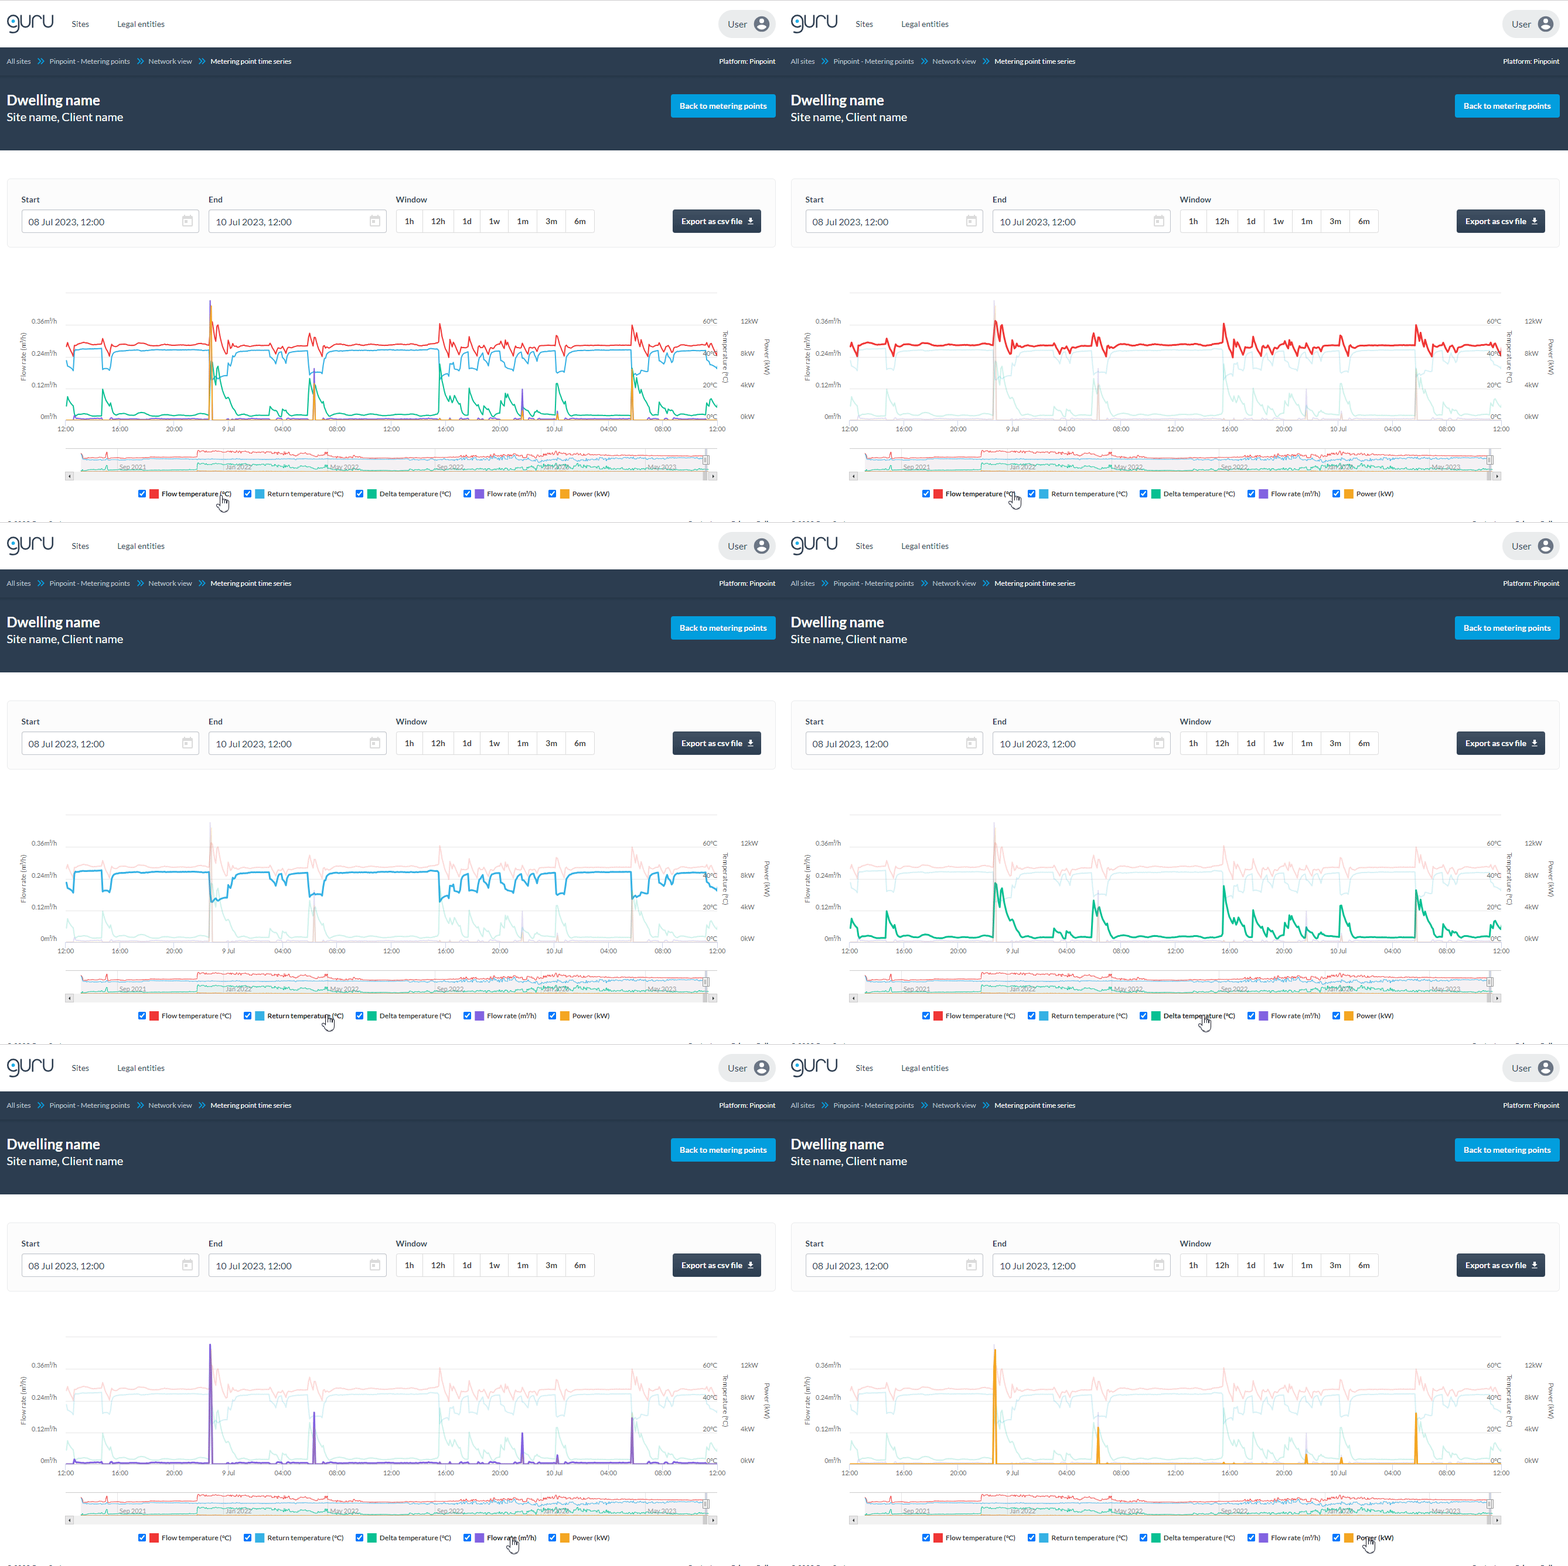
Heat meters capture data across six registers: flow temperature (°C), return temperature (°C), flow rate (m3/hour), volume (m3), instantaneous power (kW) and energy (kWh). All six registers are needed to analyse heat network performance, it’s not enough to rely on infrequent kWh readings alone.
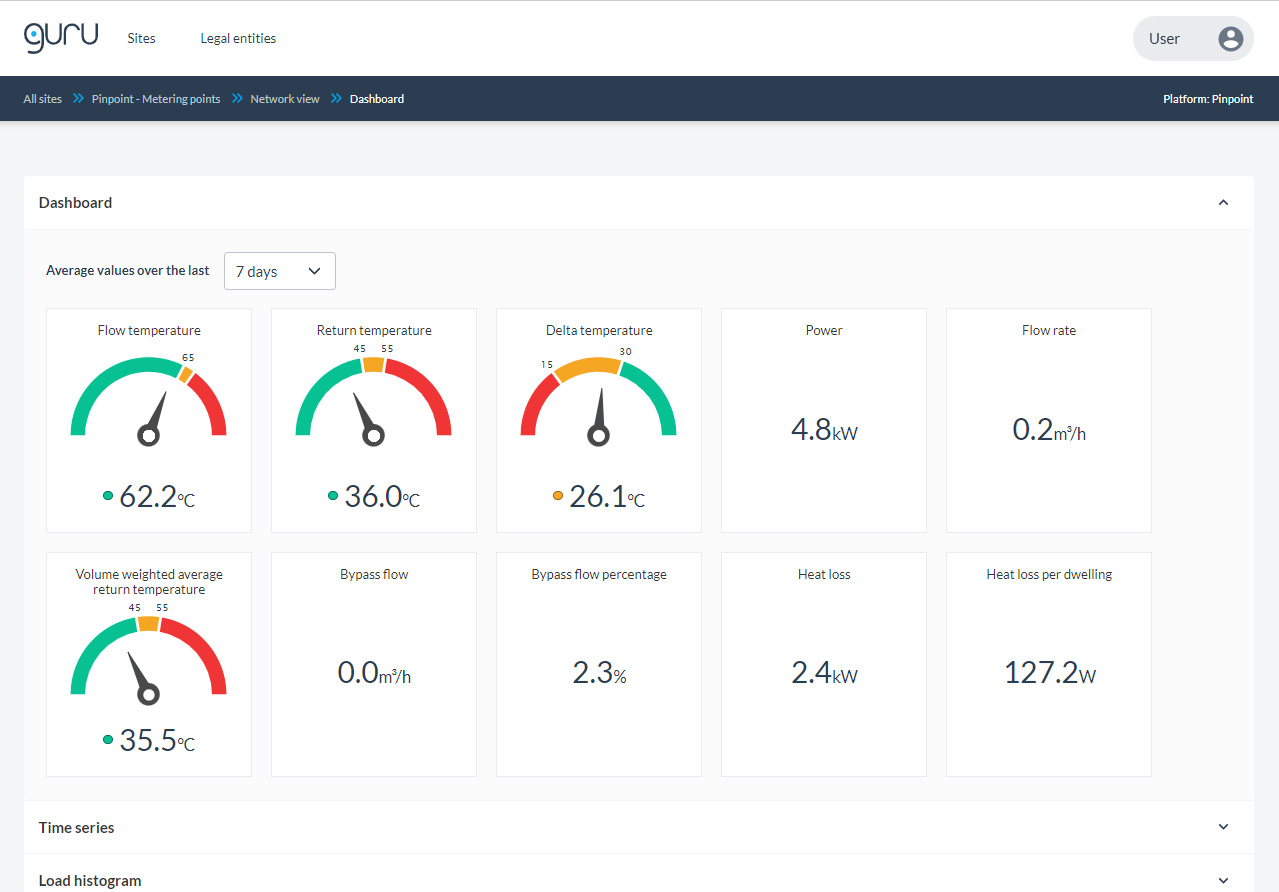
Guru Pinpoint displays this performance data and analyses all six registers – including using kWh data for heat loss calculations. View real-time readings and enhanced data including delta temperature and heat losses across a network.
CLEAR METRICS
Understand volume weighted average return temperature
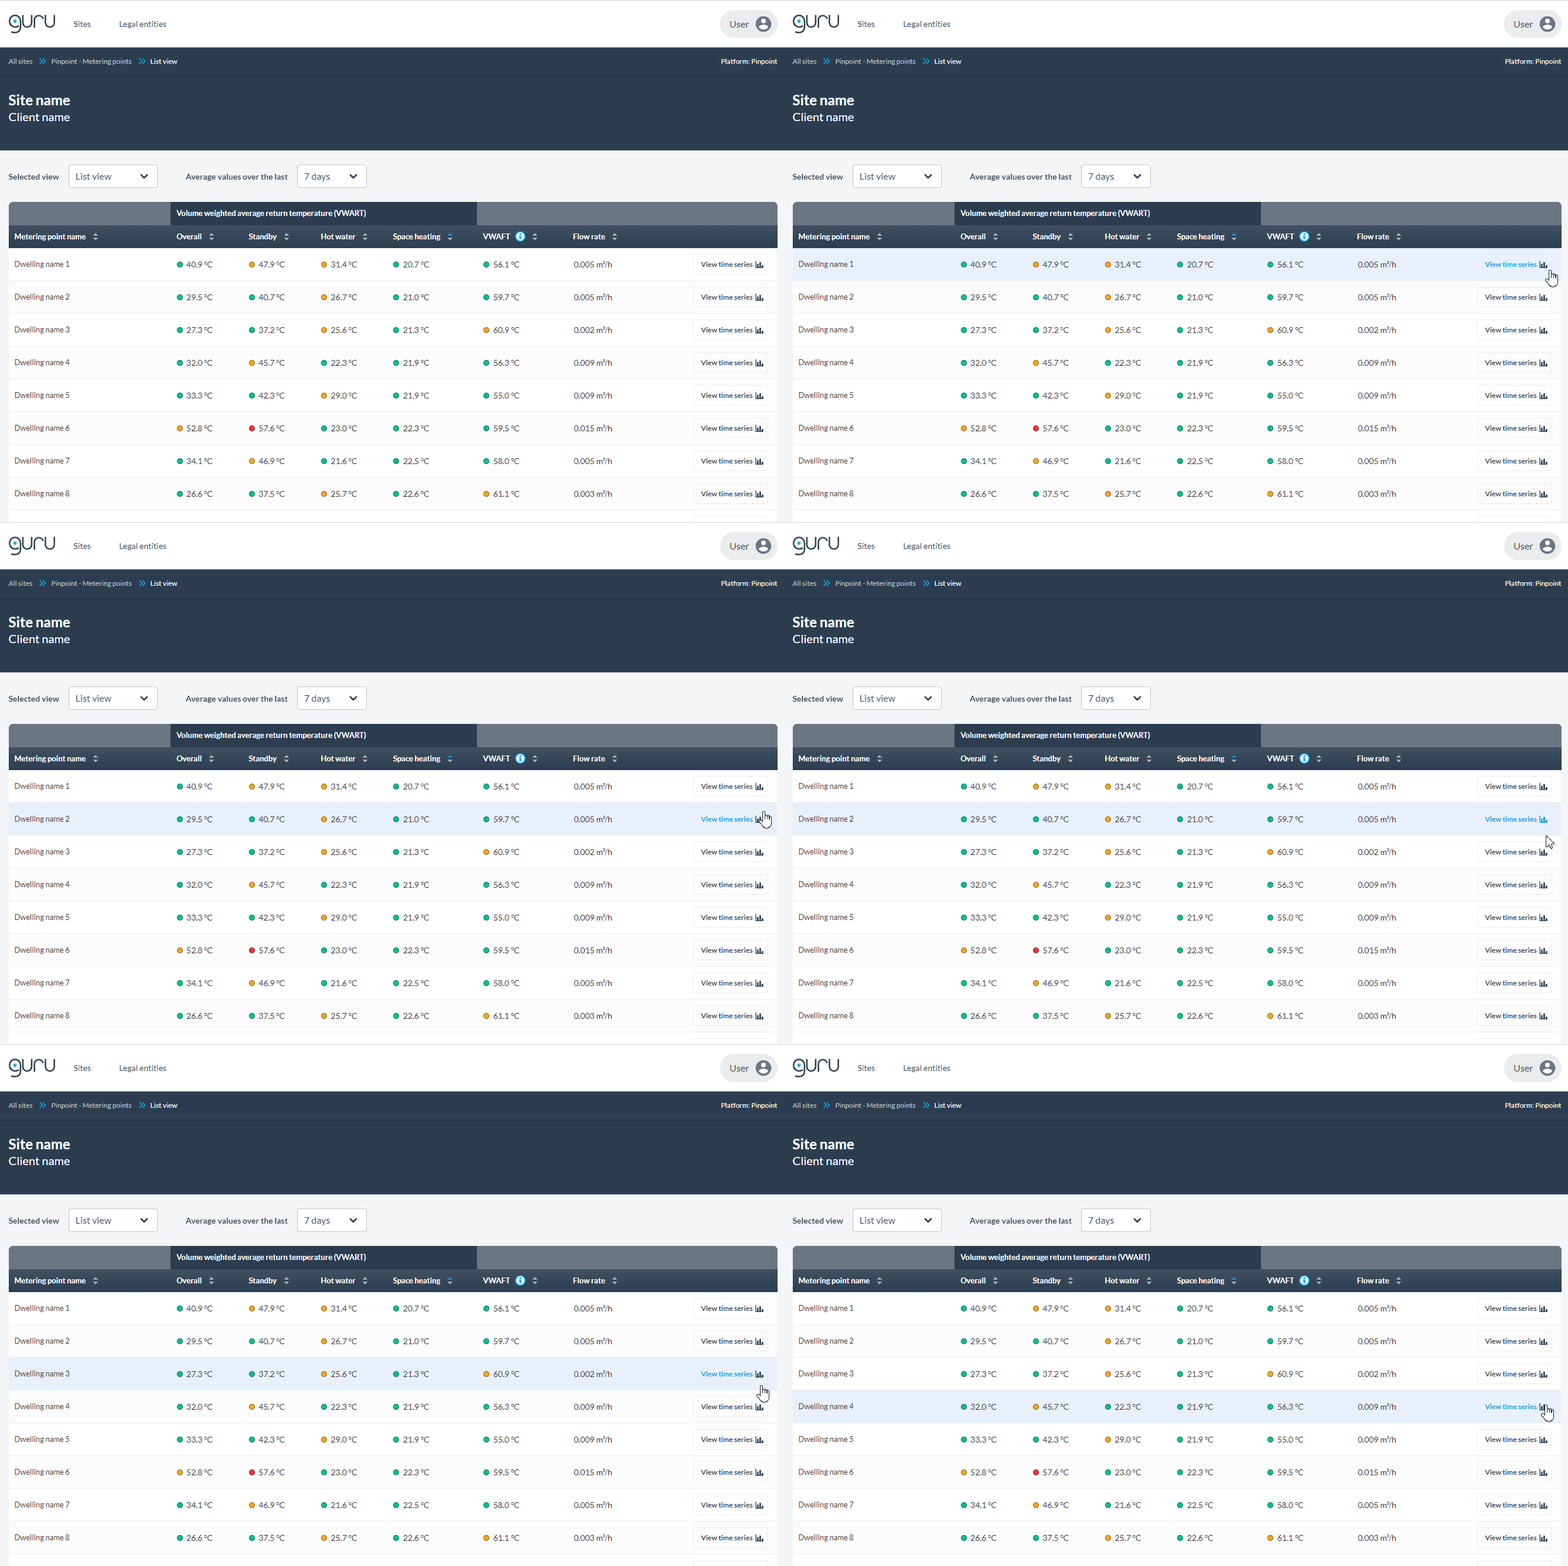
Guru Pinpoint also shows volume weighted average return temperature (VWART) by HIU mode. VWART is the best metric for understanding heat network performance as it goes beyond showing the return temperature at a point in time, and instead indicates how much water is being returned at that temperature.
Guru Pinpoint uses machine learning algorithms to determine which of the three modes an HIU is currently operating in (space heating, domestic hot water, or standby). It then calculates the volume weighted average return temperature for each mode – helping you to better diagnose problems and target maintenance visits or make remote changes.
TARGET INTERVENTIONS ACCURATELY
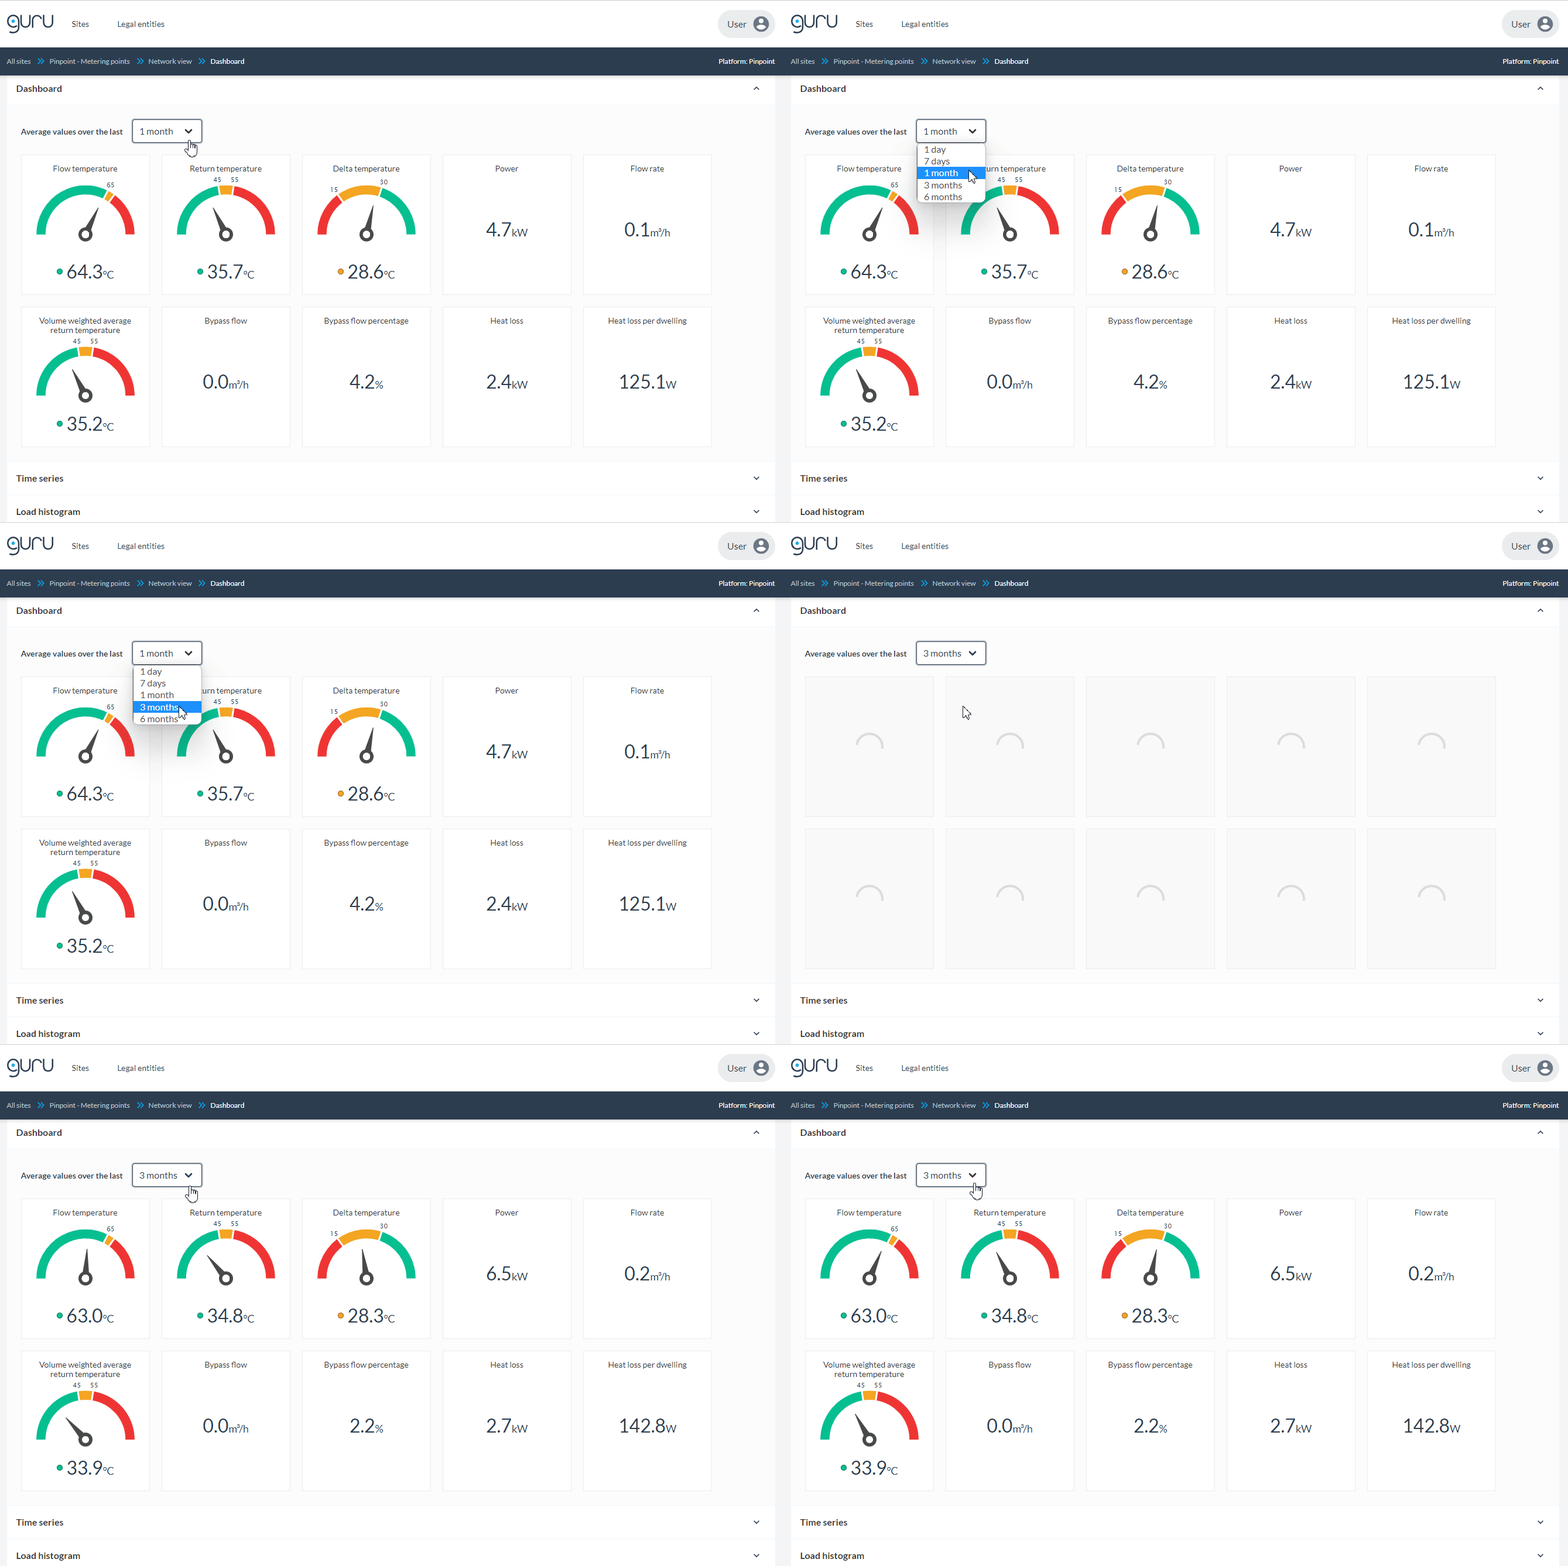
View heat losses and heat loss per dwelling
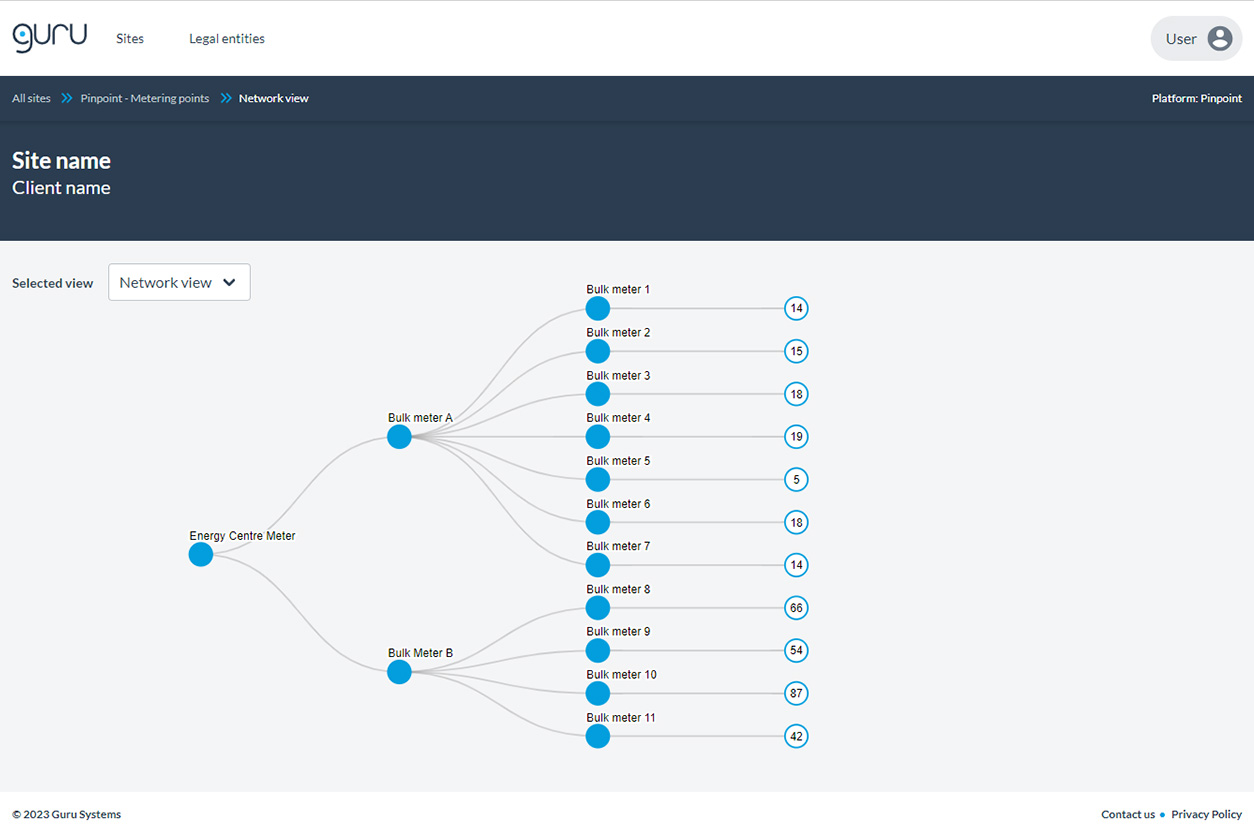
Guru Pinpoint displays total heat losses and heat loss per dwelling for the entire network, and in zones downstream of any bulk meters.
Dashboards and colour-coded network maps help to identify where heat losses are, supporting targeted interventions. Average heat loss data is available over 1 day, 7 days, 1 month, 3 months or 6 months, helping you to prepare for existing and future reporting requirements.
Being able to access up to the minute information has proved really useful. Having the information once a week, or even longer than that, means that by the time you identify an issue it could be too late and a family could have been living without heating for a significant amount of time.
Charmaine Francis, Octavia Housing
TRANSPARENCY
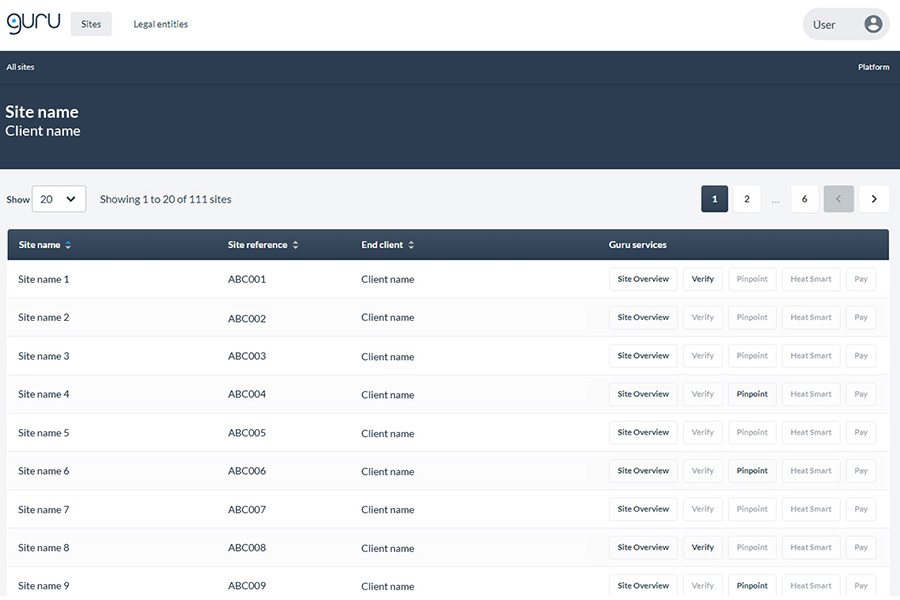
Add sites that don’t have Guru hardware installed to Guru Pinpoint
Many sites in the UK have basic monitoring systems in place – often to meet the minimum requirements of the Heat Network (Metering and Billing) Regulations. Typically sites without Guru hardware installed have a hardwired M-Bus network with a datalogger, or may have pay-as-you-go hardware from other providers. In these situations – data is usually only used to bill customers on a quarterly or monthly basis.
BUILD SKILLS
Share knowledge across teams, while complying with GDPR
Dashboards, sortable data columns, network visualisation, and our traffic light system help make heat network performance data easier to understand. Use Guru Pinpoint to share knowledge, including with non-technical teams. Guru Systems is ISO27001 accredited and all of our platforms are GDPR compliant.
Guru Pinpoint for design, handover and operation

VERIFY
Guru Pinpoint for smoother handover and adoptions
Verify heat network performance with real-time data before residents move in, or when adopting a network into your portfolio. Check agreed site-specific KPIs including return temperatures or heat losses, or minimum technical standards required by regulation.

ANALYSE
Guru Pinpoint for better performing heat networks
Unmonitored heat networks don’t usually perform well, and poorly performing networks often mean customers pay more and increased carbon emissions. Even where networks are well designed and commissioned before residents move in, performance tends to drift over time. It is not uncommon for the cost of delivered heat to double in just a few years on unwatched networks. Networks need to be monitored and managed to ensure the best ongoing performance possible, going beyond just capturing data.
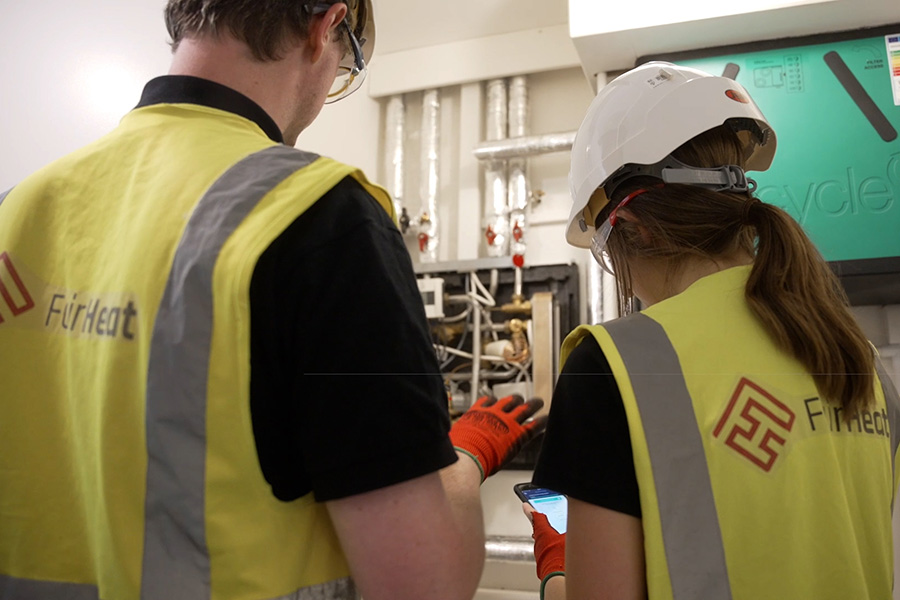
DIAGNOSE
Guru Pinpoint to support customer relations and reduce maintenance costs
Use Guru Pinpoint to help diagnose the causes of problems reported by residents. Understanding where and why problems occur helps maintenance visits to go more smoothly on the day.

GURU PINPOINT IN ACTION
Case study: Mildmay – HNES Demonstrator
Mildmay is a development-led network in Shoreditch, East London with 139 residential connections, a hospital, and a church, constructed in 2014 by Notting Hill Genesis. Guru Systems technology was installed at this site as part of the HNES Demonstrator programme in partnership with specialist engineering consultancy FairHeat and supported by housing association Notting Hill Genesis.
Read more
CPD: Guru Hub 2 commissioning and troubleshooting training
From January 2024, Guru Systems will be offering the following CPD Seminar: Guru Hub 2 commissioning and troubleshooting training Summary: [...]
Guru Systems technology is part of five successful HNES Round 1 projects
The Heat Network Efficiency Scheme (HNES) is a £32m grant funding scheme to improve the performance of existing heat networks. [...]
Guru Pinpoint for better-performing heat networks
Unmonitored heat networks don’t usually perform well; poorly performing networks mean higher costs and increased carbon emissions. Even where [...]


